Difference between revisions of "Viz/graphs.grevian.org/example"
DavidWhitten (talk | contribs) |
DavidWhitten (talk | contribs) |
||
| (5 intermediate revisions by the same user not shown) | |||
| Line 9: | Line 9: | ||
== Example 1: Simple Graph == | == Example 1: Simple Graph == | ||
| − | graph { | + | graph { |
a -- b; | a -- b; | ||
b -- c; | b -- c; | ||
| Line 16: | Line 16: | ||
e -- c; | e -- c; | ||
e -- a; | e -- a; | ||
| − | } | + | } |
| − | [[File:Graphs.grevian.org+example1.png]] | + | [[File:Graphs.grevian.org+example1.png]] |
== Example 2: K6 == | == Example 2: K6 == | ||
| − | graph { | + | graph { |
a -- b; | a -- b; | ||
b -- c; | b -- c; | ||
| Line 38: | Line 38: | ||
c -- f; | c -- f; | ||
d -- f; | d -- f; | ||
| − | } | + | } |
| − | + | ||
| − | + | [[File:Graphs.grevian.org+example2.png]] | |
== Example 3: Simple Digraph == | == Example 3: Simple Digraph == | ||
| − | digraph { | + | digraph { |
a -> b; | a -> b; | ||
b -> c; | b -> c; | ||
c -> d; | c -> d; | ||
d -> a; | d -> a; | ||
| − | } | + | } |
| − | + | ||
| − | + | [[File:Graphs.grevian.org+example3.png]] | |
== Example 4: Full Digraph == | == Example 4: Full Digraph == | ||
| − | digraph { | + | digraph { |
a -> b[label="0.2",weight="0.2"]; | a -> b[label="0.2",weight="0.2"]; | ||
a -> c[label="0.4",weight="0.4"]; | a -> c[label="0.4",weight="0.4"]; | ||
| Line 62: | Line 62: | ||
e -> e[label="0.1",weight="0.1"]; | e -> e[label="0.1",weight="0.1"]; | ||
e -> b[label="0.7",weight="0.7"]; | e -> b[label="0.7",weight="0.7"]; | ||
| − | } | + | } |
| − | + | ||
| − | + | [[File:Graphs.grevian.org+example4.png]] | |
== Example 5: Showing A Path == | == Example 5: Showing A Path == | ||
| − | graph { | + | graph { |
a -- b[color=red,penwidth=3.0]; | a -- b[color=red,penwidth=3.0]; | ||
b -- c; | b -- c; | ||
| Line 77: | Line 77: | ||
b -- d[color=red,penwidth=3.0]; | b -- d[color=red,penwidth=3.0]; | ||
c -- f[color=red,penwidth=3.0]; | c -- f[color=red,penwidth=3.0]; | ||
| − | } | + | } |
| − | + | ||
| + | [[File:Graphs.grevian.org+example5.png]] | ||
Note that there's also a shorthand method as follows: | Note that there's also a shorthand method as follows: | ||
| − | graph { | + | graph { |
a -- b -- d -- c -- f[color=red,penwidth=3.0]; | a -- b -- d -- c -- f[color=red,penwidth=3.0]; | ||
b -- c; | b -- c; | ||
| Line 88: | Line 89: | ||
e -- f; | e -- f; | ||
a -- d; | a -- d; | ||
| − | } | + | } |
| − | |||
| − | |||
== Example 6: Subgraphs == | == Example 6: Subgraphs == | ||
| Line 96: | Line 95: | ||
Please note there are some quirks here, First the name of the subgraphs are important, to be visually separated they must be prefixed with cluster_ as shown below, and second only the DOT and FDP layout methods seem to support subgraphs (See the graph generation page for more information on the layout methods) | Please note there are some quirks here, First the name of the subgraphs are important, to be visually separated they must be prefixed with cluster_ as shown below, and second only the DOT and FDP layout methods seem to support subgraphs (See the graph generation page for more information on the layout methods) | ||
| − | digraph { | + | digraph { |
subgraph cluster_0 { | subgraph cluster_0 { | ||
label="Subgraph A"; | label="Subgraph A"; | ||
| Line 109: | Line 108: | ||
f -> c; | f -> c; | ||
} | } | ||
| − | } | + | } |
| + | |||
| + | [[File:Graphs.grevian.org+example6.png]] | ||
Another Example of a Subgraph, In this example I group nodes together seperately from their edges, And also uses the graph attribute splines=line; to specify that edges should be drawn only as straight lines, no curves allowed. | Another Example of a Subgraph, In this example I group nodes together seperately from their edges, And also uses the graph attribute splines=line; to specify that edges should be drawn only as straight lines, no curves allowed. | ||
| − | graph { | + | graph { |
splines=line; | splines=line; | ||
subgraph cluster_0 { | subgraph cluster_0 { | ||
| Line 132: | Line 133: | ||
c -- d; | c -- d; | ||
c -- e; | c -- e; | ||
| − | } | + | } |
| + | |||
| + | [[File:Graphs.grevian.org+example6a.png]] | ||
| Line 138: | Line 141: | ||
To make it easier to input large graph descriptions, One may group edges together with a set of braces, It may also help to lay the graph out left to right instead of top to bottom. | To make it easier to input large graph descriptions, One may group edges together with a set of braces, It may also help to lay the graph out left to right instead of top to bottom. | ||
| − | graph { | + | graph { |
rankdir=LR; // Left to Right, instead of Top to Bottom | rankdir=LR; // Left to Right, instead of Top to Bottom | ||
a -- { b c d }; | a -- { b c d }; | ||
| Line 160: | Line 163: | ||
s -- z; | s -- z; | ||
t -- z; | t -- z; | ||
| − | } | + | } |
| − | + | ||
| + | [[File:Graphs.grevian.org+example7.png]] | ||
Another feature that can make large graphs manageable is to group nodes together at the same rank, the graph above for example is copied from a specific assignment, but doesn't look the same because of how the nodes are shifted around to fit in a more space optimal, but less visually simple way. We can make it look much more similar by grouping the nodes together for display as is done in the assignment with rank, as follows | Another feature that can make large graphs manageable is to group nodes together at the same rank, the graph above for example is copied from a specific assignment, but doesn't look the same because of how the nodes are shifted around to fit in a more space optimal, but less visually simple way. We can make it look much more similar by grouping the nodes together for display as is done in the assignment with rank, as follows | ||
| − | graph { | + | graph { |
rankdir=LR; | rankdir=LR; | ||
a -- { b c d }; b -- { c e }; c -- { e f }; d -- { f g }; e -- h; | a -- { b c d }; b -- { c e }; c -- { e f }; d -- { f g }; e -- h; | ||
| Line 177: | Line 181: | ||
{ rank=same; o, p, q, r } | { rank=same; o, p, q, r } | ||
{ rank=same; s, t } | { rank=same; s, t } | ||
| − | } | + | } |
| + | |||
| + | [[File:Graphs.grevian.org+example7a.png]] | ||
Latest revision as of 15:28, 3 February 2021
from: https://graphs.grevian.org/example
GraphViz Pocket Reference Home Examples Reference Make a Graph About this Site Related Links Contact Me Examples
GraphViz uses the DOT language to describe graphs, Below are examples of the language, with their resulting outputs.
Contents
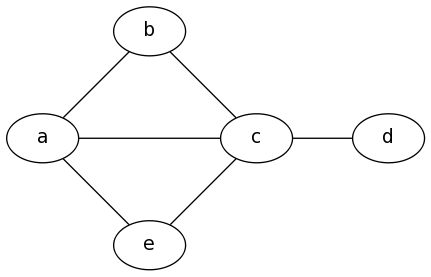
Example 1: Simple Graph
graph {
   a -- b;
   b -- c;
   a -- c;
   d -- c;
   e -- c;
   e -- a;
}

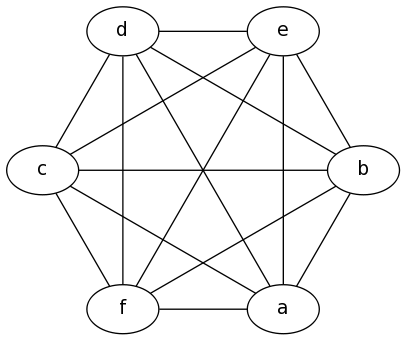
Example 2: K6
graph {
   a -- b;
   b -- c;
   c -- d;
   d -- e;
   e -- f;
   a -- f;
   a -- c;
   a -- d;
   a -- e;
   b -- d;
   b -- e;
   b -- f;
   c -- e;
   c -- f;
   d -- f;
}

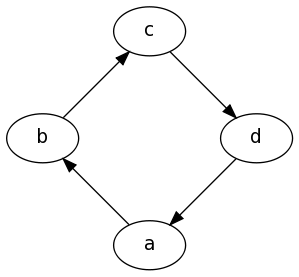
Example 3: Simple Digraph
digraph {
   a -> b;
   b -> c;
   c -> d;
   d -> a;
}

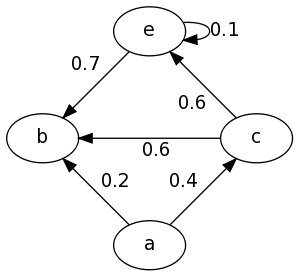
Example 4: Full Digraph
digraph {
   a -> b[label="0.2",weight="0.2"];
   a -> c[label="0.4",weight="0.4"];
   c -> b[label="0.6",weight="0.6"];
   c -> e[label="0.6",weight="0.6"];
   e -> e[label="0.1",weight="0.1"];
   e -> b[label="0.7",weight="0.7"];
}

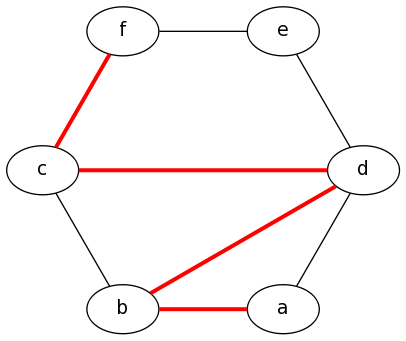
Example 5: Showing A Path
graph {
   a -- b[color=red,penwidth=3.0];
   b -- c;
   c -- d[color=red,penwidth=3.0];
   d -- e;
   e -- f;
   a -- d;
   b -- d[color=red,penwidth=3.0];
   c -- f[color=red,penwidth=3.0];
}

Note that there's also a shorthand method as follows:
graph {
   a -- b -- d -- c -- f[color=red,penwidth=3.0];
   b -- c;
   d -- e;
   e -- f;
   a -- d;
}
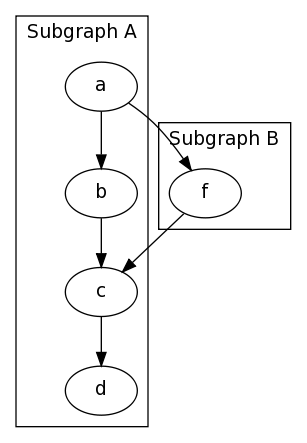
Example 6: Subgraphs
Please note there are some quirks here, First the name of the subgraphs are important, to be visually separated they must be prefixed with cluster_ as shown below, and second only the DOT and FDP layout methods seem to support subgraphs (See the graph generation page for more information on the layout methods)
digraph {
   subgraph cluster_0 {
       label="Subgraph A";
       a -> b;
       b -> c;
       c -> d;
   }
   subgraph cluster_1 {
       label="Subgraph B";
       a -> f;
       f -> c;
   }
}

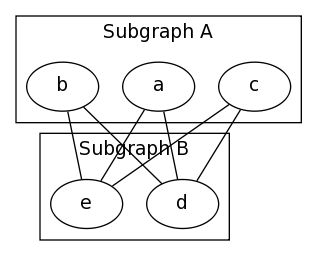
Another Example of a Subgraph, In this example I group nodes together seperately from their edges, And also uses the graph attribute splines=line; to specify that edges should be drawn only as straight lines, no curves allowed.
graph {
   splines=line;
   subgraph cluster_0 {
       label="Subgraph A";
       a; b; c
   }
   subgraph cluster_1 {
       label="Subgraph B";
       d; e;
   }
   a -- e;
   a -- d;
   b -- d;
   b -- e;
   c -- d;
   c -- e;
}

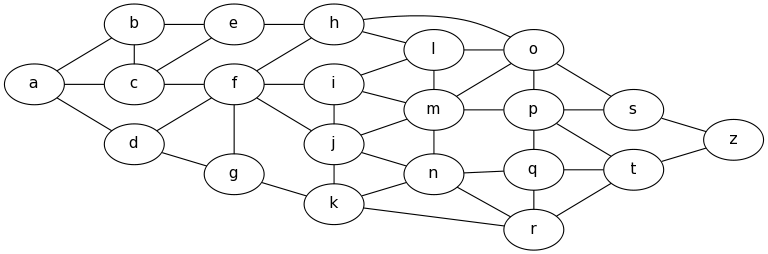
Example 7: Large Graphs To make it easier to input large graph descriptions, One may group edges together with a set of braces, It may also help to lay the graph out left to right instead of top to bottom.
graph {
   rankdir=LR; // Left to Right, instead of Top to Bottom
   a -- { b c d };
   b -- { c e };
   c -- { e f };
   d -- { f g };
   e -- h;
   f -- { h i j g };
   g -- k;
   h -- { o l };
   i -- { l m j };
   j -- { m n k };
   k -- { n r };
   l -- { o m };
   m -- { o p n };
   n -- { q r };
   o -- { s p };
   p -- { s t q };
   q -- { t r };
   r -- t;
   s -- z;
   t -- z;
}
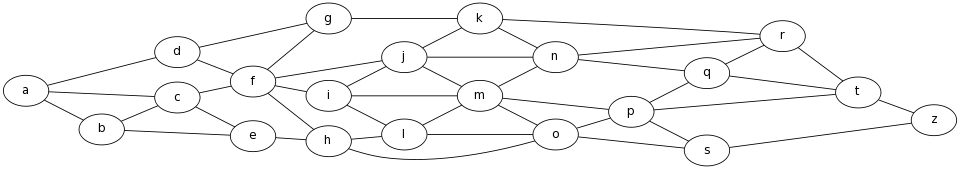

Another feature that can make large graphs manageable is to group nodes together at the same rank, the graph above for example is copied from a specific assignment, but doesn't look the same because of how the nodes are shifted around to fit in a more space optimal, but less visually simple way. We can make it look much more similar by grouping the nodes together for display as is done in the assignment with rank, as follows
graph {
   rankdir=LR;
   a -- { b c d }; b -- { c e }; c -- { e f }; d -- { f g }; e -- h;
   f -- { h i j g }; g -- k; h -- { o l }; i -- { l m j }; j -- { m n k };
   k -- { n r }; l -- { o m }; m -- { o p n }; n -- { q r };
   o -- { s p }; p -- { s t q }; q -- { t r }; r -- t; s -- z; t -- z;
   { rank=same; b, c, d }
   { rank=same; e, f, g }
   { rank=same; h, i, j, k }
   { rank=same; l, m, n }
   { rank=same; o, p, q, r }
   { rank=same; s, t }
}